How Often Food Labels Fail Their Own Calorie Math
 ChatGPT
 Claude
 AI Mode
 Perplexity
Every nutrition label prints calories next to protein, carbs and fat. Those numbers should agree: protein and carbs give about 4 kcal per gram, fat about 9. We ran that check on every product in the Open Food Facts database with a full set of macros, 2.15 million packaged foods, and counted how often the printed calories miss by a wide margin. The data is public, so anyone can rerun it.
Key findings
All figures come from the Open Food Facts export of 2026-06-01. A product "fails" when its printed calories differ from the macro math by more than 20% and by more than 40 kcal per 100 g.
| # | Finding |
|---|---|
| 1 | Of 2,151,679 packaged foods with calories, protein, carbs and fat in Open Food Facts (export of 2026-06-01), 86,554 (4.0%) list calories that miss their own macro math by more than 20% and more than 40 kcal per 100 g. |
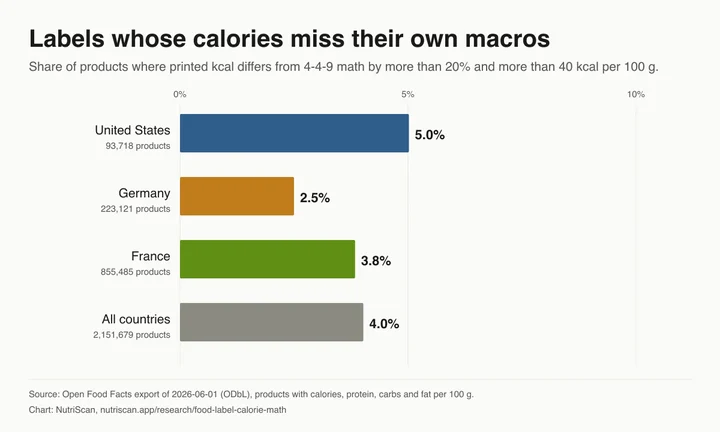
| 2 | US products failed most often, at 5.0% (4,703 of 93,718), against 3.8% in France (32,853 of 855,485) and 2.5% in Germany (5,568 of 223,121). |
| 3 | For a typical product the math holds closely: the median gap is 2.0 kcal per 100 g across all countries, 1.7 kcal in Germany, 2.0 kcal in France and 6.7 kcal in the US. |
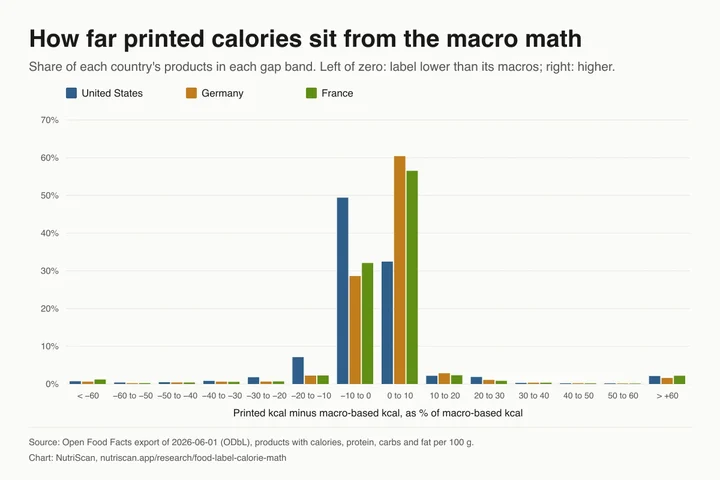
| 4 | When a label misses, it errs in both directions about equally: the printed figure was lower than the macro math in 52% of US misses, 53% of German misses and 50% of French misses. |
| 5 | Products photographed in Open Food Facts since June 2024 failed at 2.9% (12,427 of 425,938), against 4.8% for products whose newest photo is older (70,887 of 1,480,785). |
Results by country
A product counts in every country listed in its Open Food Facts country tags, so one product sold in Germany and France counts in both. "All countries" counts each product once.
| Country | Products with full macros | Labels that miss | Miss rate | Median gap, kcal per 100 g | Median gap, % | Misses where label is lower | Misses where label is higher |
|---|---|---|---|---|---|---|---|
| United States | 93,718 | 4,703 | 5.0% | 6.7 | 3.3% | 2,451 (52%) | 2,252 (48%) |
| Germany | 223,121 | 5,568 | 2.5% | 1.7 | 0.9% | 2,958 (53%) | 2,610 (47%) |
| France | 855,485 | 32,853 | 3.8% | 2.0 | 0.9% | 16,477 (50%) | 16,376 (50%) |
| All countries | 2,151,679 | 86,554 | 4.0% | 2.0 | 1.1% | 42,103 (49%) | 44,451 (51%) |
Most labels sit very close to the math. 89% of German products and 89% of French products fall within 10% of it, against 82% of US products. The US spread is wider because US labels round calories per serving, often to the nearest 5 or 10 kcal, and the per-100 g figure inherits that rounding.
Which foods miss most
Most misses (52,337 of 86,554) have no category in Open Food Facts. Among the rest, the largest groups were sugar-free chewing gum (1,187), candies (1,062), breads (525), chewing gum (384) and confectionery (313). Sugar-free gum and candy are sweetened with polyols, which carry fewer calories per gram than sugar, so a large gap there is expected and lawful. In the US the largest named group was bread (321 misses).
Fresh photos vs older photos
| Group | Newest photo since June 2024 | Older newest photo | No photo |
|---|---|---|---|
| United States | 6.3% of 43,280 | 6.3% of 20,450 | 2.3% of 29,988 |
| Germany | 2.3% of 68,600 | 2.8% of 125,251 | 1.5% of 29,270 |
| France | 2.4% of 152,504 | 4.2% of 684,775 | 1.4% of 18,206 |
| All countries | 2.9% of 425,938 | 4.8% of 1,480,785 | 1.3% of 244,956 |
Products with a recent photo miss less often in France and in the full set, and about as often in the US. Products with no photo miss least. One likely reason is that Open Food Facts loads many of them in bulk from producer data feeds instead of typing them from a pack photo, which would mean a share of the misses are typing errors in the database. We used the photo date because every product with full macros shows a last-modified date in 2026, so that date says nothing about when anyone last looked at the label.
Why the math can be off for good reasons
A gap does not prove the label is wrong. Food law in both the EU and the US allows several ways to arrive at the printed figure.
- Polyols and sugar alcohols. EU rules count polyols at 2.4 kcal per gram and erythritol at 0. Sugar-free gum, mints and low-sugar bars therefore print far fewer calories than 4 kcal per gram of carbohydrate would give.
- Fibre. In the EU, fibre is listed apart from carbohydrate and counts 2 kcal per gram. In the US, total carbohydrate includes fibre, and makers may subtract insoluble fibre before applying 4 kcal per gram. Our formula adds 2 kcal per gram of fibre on top of carbohydrate, which suits EU labels. Dropping the fibre term left the US miss rate at 5.0%, and raised Germany to 2.9% and France to 4.1%.
- Rounding. US labels round calories per serving to the nearest 5 kcal (or 10 kcal above 50 kcal), and grams to the nearest whole or half gram. On a small serving, converting to 100 g can magnify that rounding into a gap of 10% or more.
- Specific Atwater factors. The general 4-4-9 factors are averages. Makers may use food-specific factors, such as lower values for some grains, nuts and vegetables, or measure energy by lab methods.
- Alcohol and organic acids. Alcohol gives 7 kcal per gram and organic acids 3 kcal per gram in the EU. Open Food Facts often lacks the alcohol value for drinks and has no organic acid field, so drinks with these can look off.
Methodology
| Item | Detail |
|---|---|
| Source | Open Food Facts CSV export (en.openfoodfacts.org.products.csv), dated 2026-06-01, 4,535,553 products. Open Food Facts is a crowd-sourced database of packaged foods. |
| Kept | Products with numeric values for energy (kcal), protein, carbohydrate and fat per 100 g: 2,197,812. |
| Sanity filter | Left out 46,133 products with a value that cannot be right: any macro below 0 g or above 100 g, macros summing to more than 105 g, or energy above 950 kcal or at or below 0 kcal per 100 g. This leaves 2,151,679 products. |
| Formula | Expected kcal = 4 x protein + 4 x carbohydrate + 9 x fat, plus 2 x fibre and 7 x alcohol where Open Food Facts has those values. |
| Miss | Printed kcal differs from expected kcal by more than 20% of expected and by more than 40 kcal per 100 g. Both conditions must hold, so low-calorie foods do not fail on a few kcal. |
| Country | From the product's country tags: en:united-states, en:germany, en:france. A product can count in more than one country. |
| Photo date | The date of the newest product photo (last_image_t). Products photographed since 2024-06-01 count as recent. |
| Limits | Open Food Facts data-entry errors and real label errors land in the same bucket, and this study cannot tell them apart. The numbers describe products in the database, not products weighted by sales. The fibre term suits EU labels better than US labels. The study checks the label against itself, and says nothing about whether the food matches the label. |
| Code | Two Python scripts stream the export row by row and draw the charts. Run time on a laptop: under 2 minutes. |
| Conflict of interest | NutriScan makes a nutrition app that reads labels and links to it from this page. All figures here come from public Open Food Facts data. |
Disclosure
NutriScan makes a calorie and nutrition tracking app with a label scanner. The scanner reads the numbers printed on the label. It does not correct a label whose calories disagree with its own macros. NutriScan did not pay for or edit any data in Open Food Facts.
Dataset
Download the aggregate table (CSV). It has one row per country and bucket: products checked, misses, misses with the label lower or higher, the photo-date groups and the gap distribution in 10% bands. It holds counts only, with no barcodes or product names.
Data: Open Food Facts, https://world.openfoodfacts.org, ODbL. The derived table is also released under the Open Database License (ODbL) 1.0.
To cite this page: NutriScan, "How Often Food Labels Fail Their Own Calorie Math", nutriscan.app/research/food-label-calorie-math, published 2026-10-31. The charts carry a credit line and can be reused with a link back.
Related research: Fast-food calories by country and Which calorie apps ChatGPT recommends, by country. For the databases NutriScan itself draws on, see data sources.
Reading a label for the amount you ate
A label gives values per 100 g or per serving, and you rarely eat exactly that. In the NutriScan app you photograph the label, and it reads calories, protein, carbs, fat and fibre, then scales them to the amount you ate and adds them to your day. Each meal also gets an A to E meal grade. The free plan includes 5 AI scans a week. Premium costs about $59 a year and removes the weekly limit.