When Each Country Eats: Meal Times in the US, Germany, France and More
 ChatGPT
 Claude
 AI Mode
 Perplexity
We took the time of day at which NutriScan users log breakfast, lunch and dinner and grouped it by country. The median dinner in the United States, Germany and the United Kingdom lands between 7:54 and 7:57 pm. In Spain it lands an hour later. This page gives the median and the middle half of logs for every meal slot in nine countries, how the numbers were built, and a CSV you can reuse.
Key findings
All times are local to the user. "Median" is the time by which half of the logs in that cell were made.
| # | Finding |
|---|---|
| 1 | US users log dinner at a median of 7:54 pm (12,402 dinners from 1,438 users). Germany (7:55 pm, 1,131 users) and the UK (7:57 pm, 375 users) sit within three minutes of that, and French users eat about ten minutes later at 8:06 pm (473 users). |
| 2 | Spanish users log dinner at a median of 8:54 pm, an hour after users in the US, Germany and the UK (5,227 dinners from 858 users). Spain is also the late-lunch country, with a median of 2:02 pm (1,007 users), against 1:00 pm in France (603 users) and 1:05 pm in the US (1,708 users). |
| 3 | US users log breakfast at a median of 8:00 am (1,479 users). German users log it at 8:32 am (1,146 users) and UK users at 8:33 am (356 users), about half an hour later. |
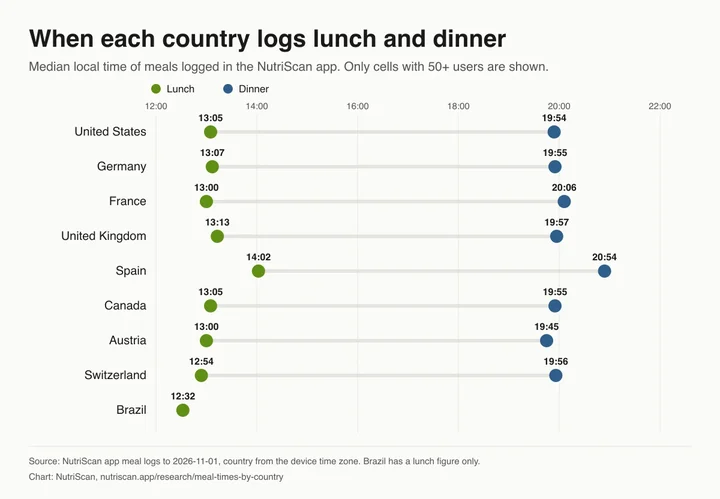
Chart: NutriScan, nutriscan.app/research/meal-times-by-country. Reuse it with a link back to this page.
Results by meal slot
Each table lists the cells with at least 50 users. The 25th and 75th percentiles mark the middle half of logs. Countries run in the order United States, Germany, France, then the United Kingdom, Spain, Canada, Austria, Switzerland and Brazil.
Breakfast
| Country | Logs | Users | Median | 25th percentile | 75th percentile |
|---|---|---|---|---|---|
| United States | 15,460 | 1,479 | 08:00 | n/a | 09:31 |
| Germany | 12,860 | 1,146 | 08:32 | 06:31 | 10:00 |
| France | 3,151 | 393 | 08:21 | 06:31 | 09:53 |
| United Kingdom | 3,345 | 356 | 08:33 | n/a | 09:56 |
| Spain | 3,971 | 658 | 08:27 | 06:36 | 10:50 |
| Canada | 2,279 | 241 | 09:03 | 07:35 | 12:03 |
| Austria | 711 | 112 | 08:15 | 06:15 | 09:39 |
| Switzerland | 859 | 99 | 08:00 | 06:34 | 09:28 |
The 25th percentile for the United States and the United Kingdom is shown as n/a: it computed to 04:00, which is not a real breakfast time. See the breakfast row of the method table before reading anything into the spread of breakfast.
Mid-morning
| Country | Logs | Users | Median | 25th percentile | 75th percentile |
|---|---|---|---|---|---|
| United States | 7,229 | 1,214 | 10:53 | 10:10 | 11:36 |
| Germany | 4,884 | 836 | 10:57 | 10:14 | 11:42 |
| France | 1,101 | 236 | 11:10 | 10:30 | 11:55 |
| United Kingdom | 1,697 | 304 | 11:00 | 10:19 | 11:45 |
| Spain | 1,607 | 506 | 10:57 | 10:27 | 11:46 |
| Canada | 1,434 | 218 | 10:49 | 10:06 | 11:42 |
| Austria | 545 | 90 | 11:05 | 10:15 | 11:55 |
| Switzerland | 353 | 64 | 11:04 | 10:22 | 11:42 |
Lunch
| Country | Logs | Users | Median | 25th percentile | 75th percentile |
|---|---|---|---|---|---|
| United States | 12,436 | 1,708 | 13:05 | 12:15 | 14:14 |
| Germany | 11,401 | 1,322 | 13:07 | 12:21 | 14:11 |
| France | 4,456 | 603 | 13:00 | 12:24 | 13:55 |
| United Kingdom | 4,414 | 413 | 13:13 | 12:22 | 14:22 |
| Spain | 5,330 | 1,007 | 14:02 | 13:00 | 14:51 |
| Canada | 2,532 | 290 | 13:05 | 12:16 | 14:19 |
| Austria | 1,044 | 140 | 13:00 | 12:15 | 14:01 |
| Switzerland | 1,141 | 106 | 12:54 | 12:17 | 13:41 |
| Brazil | 337 | 69 | 12:32 | 12:12 | 13:17 |
Afternoon
| Country | Logs | Users | Median | 25th percentile | 75th percentile |
|---|---|---|---|---|---|
| United States | 12,092 | 1,471 | 16:37 | 15:25 | 17:57 |
| Germany | 10,843 | 1,219 | 16:38 | 15:25 | 18:01 |
| France | 2,799 | 372 | 17:07 | 15:55 | 18:25 |
| United Kingdom | 3,426 | 370 | 16:50 | 15:32 | 18:04 |
| Spain | 3,382 | 756 | 16:32 | 15:25 | 17:56 |
| Canada | 2,394 | 282 | 16:48 | 15:25 | 18:12 |
| Austria | 1,526 | 128 | 15:00 | 15:00 | 17:03 |
| Switzerland | 761 | 85 | 17:01 | 15:33 | 18:17 |
Dinner
| Country | Logs | Users | Median | 25th percentile | 75th percentile |
|---|---|---|---|---|---|
| United States | 12,402 | 1,438 | 19:54 | 19:00 | 20:56 |
| Germany | 12,975 | 1,131 | 19:55 | 19:00 | 20:52 |
| France | 4,611 | 473 | 20:06 | 19:16 | 21:09 |
| United Kingdom | 4,525 | 375 | 19:57 | 18:53 | 21:00 |
| Spain | 5,227 | 858 | 20:54 | 19:45 | 21:42 |
| Canada | 2,919 | 274 | 19:55 | 19:00 | 20:51 |
| Austria | 693 | 118 | 19:45 | 18:47 | 20:48 |
| Switzerland | 1,279 | 93 | 19:56 | 19:11 | 20:51 |
Bed-time
| Country | Logs | Users | Median | 25th percentile | 75th percentile |
|---|---|---|---|---|---|
| United States | 1,492 | 344 | 22:14 | 18:26 | 23:08 |
| Germany | 1,679 | 272 | 22:01 | 17:22 | 23:09 |
| France | 990 | 83 | 23:06 | 22:03 | 23:27 |
| United Kingdom | 814 | 109 | 22:10 | 19:31 | 23:03 |
| Spain | 669 | 196 | 22:31 | 21:02 | 23:16 |
| Canada | 486 | 75 | 22:03 | 16:57 | 23:09 |
Austria and Switzerland have too few bed-time users, and Brazil has too few users in every slot but lunch, so those cells are left out.
Cells left out
Cells with fewer than 50 users are not published. They were:
| Country | Meal slot | Logs | Users |
|---|---|---|---|
| Austria | bed-time | 41 | 17 |
| Switzerland | bed-time | 172 | 25 |
| Brazil | breakfast | 438 | 46 |
| Brazil | mid-morning | 150 | 26 |
| Brazil | afternoon | 392 | 40 |
| Brazil | dinner | 116 | 46 |
| Brazil | bed-time | 9 | 8 |
Logs with an empty or free-text meal slot were also dropped. Each country had fewer than 50 of them, from 1 to 5 users.
Methodology
| Item | Detail |
|---|---|
| Source | Meal logs made in the NutriScan app, read from the app database on 2026-11-01. The data runs up to that date. Only grouped counts, medians and percentiles left the database, with no row-level export and no per-user series. |
| Country | Taken from the time zone saved in the user's profile, which comes from the device. It is mapped to a country with the table below. A user is counted once, under the time zone on their latest profile row. |
| Meal slot | The slot the user picked in the app: breakfast, mid-morning, lunch, afternoon, dinner or bed-time. The time is the time the log was created, converted to the user's own time zone. |
| Statistics | Median, 25th and 75th percentile of the local time of day, with logs and distinct users per cell. |
| Floor | A cell is published only when at least 50 distinct users logged that meal slot in that country. |
| Exclusions | Sample meals, deleted accounts, meals under 1 kcal or over 4,000 kcal, and logs stamped between 00:00 and 00:59 local time, which are mostly meals added for a past day. |
| Breakfast check | The 25th percentile of US and UK breakfast is exactly 04:00. We checked US breakfast logs from the last 90 days: of 3,987, none were stamped exactly 04:00:00 and 1,049 (26%) fell between 03:30 and 04:30. A cluster that size points to a default time stamped on some backfilled or edited breakfasts. Medians barely move with it, so they are published, but breakfast spread is not interpreted here. We did not check the UK or recompute breakfast without those logs. |
| Limits | Users pick the slot and often round the time, so times cluster on round values such as 13:00 and 20:00. People who set a time zone that differs from where they live are counted in the wrong country. Canada, Austria and Switzerland cells have 64 to 290 users, and Brazil passes the floor for lunch only. These are people who log meals in a calorie app, not a sample of each country. |
| Conflict of interest | The data is NutriScan's own, and NutriScan sells a calorie tracking app. |
Time zones that count as each country, with the users who made at least one real meal log (all time, 1 to 4,000 kcal):
| Time zone | Country | Users with a real meal log |
|---|---|---|
| America/New_York | US | 1,671 |
| America/Chicago | US | 965 |
| America/Los_Angeles | US | 723 |
| America/Denver | US | 176 |
| America/Phoenix | US | 86 |
| America/Detroit | US | 63 |
| Europe/Berlin | DE | 2,966 |
| Europe/Paris | FR | 1,175 |
| Europe/London | GB | 924 |
| Europe/Madrid | ES | 1,923 |
| Atlantic/Canary | ES | 84 |
| America/Toronto | CA | 483 |
| America/Edmonton | CA | 84 |
| America/Vancouver | CA | 80 |
| Europe/Vienna | AT | 304 |
| Europe/Zurich | CH | 213 |
| America/Sao_Paulo | BR | 147 |
Four zones were left out because each had under 50 users: America/Indiana/Indianapolis (42), Pacific/Honolulu (20), America/Winnipeg (25) and America/Halifax (23). No other zone in these countries reached 20 users.
Privacy
The country comes from the device time zone only. No city, state or location field was used. Every published figure covers at least 50 users, and nothing on this page or in the CSV identifies a person. Health goals, health platform data, chat, voice, email and payments were not used. The privacy policy lists the publishing of aggregate statistics as a purpose.
Dataset
Download the meal times by country (CSV). It has one row per country and meal slot that passed the 50-user floor (47 rows): country, meal slot, logs, users, median, 25th and 75th percentile local time, and the date the data runs to. NutriScan releases the table under Creative Commons Attribution 4.0 (CC BY 4.0); reuse it with credit and a link to this page.
To cite this page: NutriScan, "When Each Country Eats: Meal Times in the US, Germany, France and More", nutriscan.app/research/meal-times-by-country, published 2026-11-01. The chart carries a credit line and can be reused with a link back.
Related research: Which calorie apps ChatGPT recommends and Fast-food calories by country.
Where NutriScan fits
NutriScan works from a photo: you photograph the meal, check the items and portions it finds, and get calories, protein, carbs and fat. Each meal gets a time stamp and a slot, and you can add a meal for a past day if you forgot to log it. The free plan includes 5 AI scans a week. Premium costs about $59 a year and removes the weekly limit. NutriScan has 150k+ downloads and a 4.6-star rating.