How People Log Food in NutriScan, by Country
 ChatGPT
 Claude
 AI Mode
 Perplexity
We counted how 12,984 NutriScan users logged 199,937 meals between 2026-06-29 and 2026-11-01. The counts show how often people type a meal, photograph it, log a packaged food or copy an earlier meal, and how often they tag a meal as raw, air-fried or deep-fried. NutriScan makes the app these meals were logged in, so this page covers NutriScan users only. They are not a sample of everyone who tracks calories.
Key findings
| # | Finding |
|---|---|
| 1 | 25.2% of meals were a copy or repeat of an earlier meal (50,333 of 199,937), yet only 847 of 12,984 users (6.5%) used copy or repeat at all. It is a heavy-user habit. |
| 2 | Air-fried meals outnumbered deep-fried meals 2,068 to 1,333. The number of users was close to even (773 logged an air-fried meal, 809 a deep-fried one), so air-fryer owners log theirs more often. |
| 3 | Raw food was 10.5% of French meals, 6.8% of German meals and 2.9% of US meals. Among meals that carry a specific cooking label, raw was 47.2% in France, 38.8% in Germany and 20.9% in the US. |
| 4 | 47.8% of meals were typed, 36.4% came from a photo and 14.3% were packaged food. Each mode was used by thousands of users (5,901 typed, 9,050 photo, 3,041 packaged). |
| 5 | The mix differs by country. Typed meals were 52.5% in the US, 45.9% in Germany and 51.3% in France. Photo meals were 23.4%, 29.0% and 27.9%. Packaged food was 20.8%, 25.0% and 20.2%. |
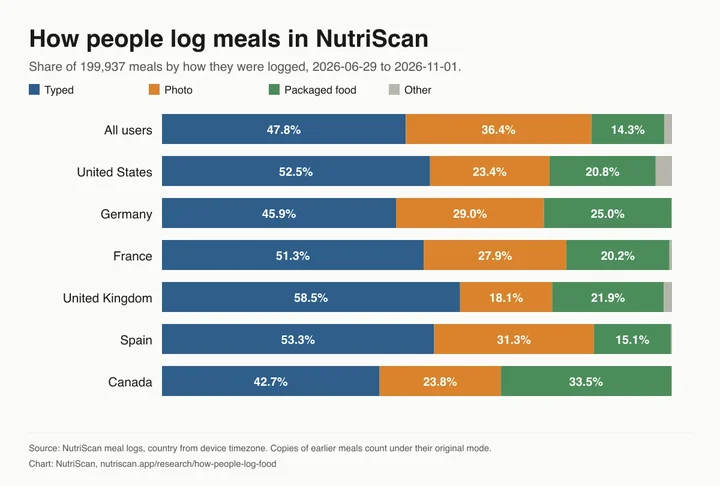
How meals were logged
Every meal has a logging mode. "Typed" is a meal entered by hand. "Photo" is a meal scanned from a picture. "Packaged" is a packaged food logged through the packaged-food mode. A meal copied or repeated from an earlier one counts under the mode of the original. "Other" holds diet-plan entries and older mode values. Shares are of all meals in the country.
| Country | Meals | Users | Typed | Photo | Packaged | Other | Users typed / photo / packaged |
|---|---|---|---|---|---|---|---|
| All users | 199,937 | 12,984 | 95,577 (47.8%) | 72,680 (36.4%) | 28,613 (14.3%) | 3,067 (1.5%) | 5,901 / 9,050 / 3,041 |
| United States | 24,685 | 925 | 12,964 (52.5%) | 5,786 (23.4%) | 5,136 (20.8%) | 799 (3.2%) | 587 / 571 / 351 |
| Germany | 25,978 | 710 | 11,936 (45.9%) | 7,539 (29.0%) | 6,486 (25.0%) | 17 (0.1%) | 395 / 489 / 303 |
| France | 7,300 | 286 | 3,748 (51.3%) | 2,039 (27.9%) | 1,475 (20.2%) | 38 (0.5%) | 148 / 198 / 83 |
| United Kingdom | 7,466 | 208 | 4,364 (58.5%) | 1,348 (18.1%) | 1,636 (21.9%) | 118 (1.6%) | 121 / 142 / 82 |
| Spain | 8,930 | 534 | 4,764 (53.3%) | 2,797 (31.3%) | 1,350 (15.1%) | 19 (0.2%) | 239 / 404 / 153 |
| Canada | 6,337 | 150 | 2,704 (42.7%) | 1,506 (23.8%) | 2,123 (33.5%) | 4 (0.1%) | 103 / 95 / 57 |
Austria, Switzerland and Brazil are left out of this table. Each has fewer than 50 users in at least one mode.
Copy and repeat meals
Of 199,937 meals, 50,333 (25.2%) were copies or repeats of an earlier meal. They came from 847 users, 6.5% of the 12,984 who logged a meal. A small group leans on copy and repeat heavily, and most users never use it. Two countries have at least 50 copy or repeat users to report on their own.
| Country | Copy or repeat meals, share of all meals | Users |
|---|---|---|
| All users | 25.2% | 847 |
| United States | 29.2% | 116 |
| Germany | 35.4% | 120 |
France, the United Kingdom, Spain and Canada each had fewer than 50 copy or repeat users, so their shares are not published.
Raw, air-fried and deep-fried meals
Raw is shown against two denominators. "All meals" is every meal logged in the country. "Specific-label meals" counts only meals whose cooking label is something other than "mixed" or "not sure". 84% of meals carry no specific label, so the second column describes the labelled minority.
| Country | Raw, share of all meals | Raw, share of specific-label meals | Users with a raw meal |
|---|---|---|---|
| All users | 4.0% | 24.6% | 2,004 |
| United States | 2.9% | 20.9% | 159 |
| Germany | 6.8% | 38.8% | 217 |
| France | 10.5% | 47.2% | 75 |
| Spain | 5.4% | 29.0% | 150 |
Meals with a specific cooking label were 32,859 of 199,937 (16.4%). The United Kingdom and Canada had under 50 users with a raw meal, so they are not listed.
Air-fried and deep-fried counts are published for all users and for the countries with 50 or more users on each label.
| Scope | Air-fried meals (users) | Deep-fried meals (users) |
|---|---|---|
| All users | 2,068 (773) | 1,333 (809) |
| United States | 182 (88) | 169 (65) |
| Germany | 280 (66) | not published |
Germany's deep-fried count and every fried-food count for other countries rest on fewer than 50 users per label, so they are left out.
Methodology
| Item | Detail |
|---|---|
| Source | NutriScan's own meal log. Only grouped counts were read, in read-only queries. No row-level data leaves the database and none is in the CSV. |
| Window | 2026-06-29 to 2026-11-01. The logging mode was first recorded on 2026-06-29, so earlier meals have no mode. |
| Meals counted | Real meals with 1 to 4,000 kcal. Sample meals, meals outside that range and deleted accounts are excluded. That leaves 199,937 meals from 12,984 users. |
| Copy or repeat | The mode name of a copied or repeated meal ends in "copy meal" or "repeat meal". A meal is a copy or repeat if its mode matches either. |
| Typed, photo, packaged | The mode name with the copy or repeat ending removed. Manual and manual logging count as typed. Image scan and meal scan count as photo. Package food counts as packaged. Everything else, including a missing mode, counts as other. Because copies keep their original mode, the split describes where meals came from, not only how many were entered fresh. |
| Cooking label | Each meal can carry labels such as raw, boiled, air-fried or deep-fried. The label is a guess made from the photo or the meal name. Most labelled meals say only "mixed" or "not sure". Counts here describe meals with a label and say nothing about how all food was cooked. |
| Country | Each user's device timezone, mapped to a country: six US zones (New York, Chicago, Los Angeles, Denver, Phoenix, Detroit), Berlin for Germany, Paris for France, London for the United Kingdom, Madrid and the Canary Islands for Spain, and Toronto, Edmonton and Vancouver for Canada. Vienna, Zurich and Sao Paulo were mapped too, but those countries do not meet the 50-user floor in any table. Timezones with fewer than 50 users were left out. A timezone shows where a phone is set, not where a person lives. |
| Limits | These are NutriScan users, so the figures describe this app's users only. Copy and repeat share is driven by about 850 users. The window covers four months, so a rerun may shift the shares. |
Privacy
Country comes from the device timezone only. No figure covers fewer than 50 users, and the tables leave those cells out instead of rounding them. No city or state is used. No food item is named or ranked below 20 users, and this page names none. Only grouped counts are published, and nothing here can identify a person.
Dataset
Download the logging table (CSV). It has one row per country (7 rows): meals, users, meals and users by logging mode, copy and repeat share, raw shares, and air-fried and deep-fried counts, with an empty cell wherever the 50-user floor applies. NutriScan releases the table under Creative Commons Attribution 4.0 (CC BY 4.0); reuse it with credit and a link to this page.
To cite this page: NutriScan, "How People Log Food in NutriScan, by Country", nutriscan.app/research/how-people-log-food, published 2026-11-01. The chart carries a credit line and can be reused with a link back.
Why repeat meals matter for tracking
A quarter of logged meals were copies, so repeat logging is common among the users who use it. If you eat the same meals most days, repeating them works for tracking as long as the portions match what you ate. In NutriScan you photograph a new meal and it counts calories from the photo, or you scan a packaged food with the nutrition label scanner. Copy a meal you eat often and adjust the portion when it changes. The free plan includes 5 AI scans a week. Premium costs about $59 a year and removes the weekly limit. NutriScan has 150k+ downloads and a 4.6-star rating.