Glycemic Index vs Glycemic Load: What Each Number Tells You
 ChatGPT
 Claude
 AI Mode
 Perplexity
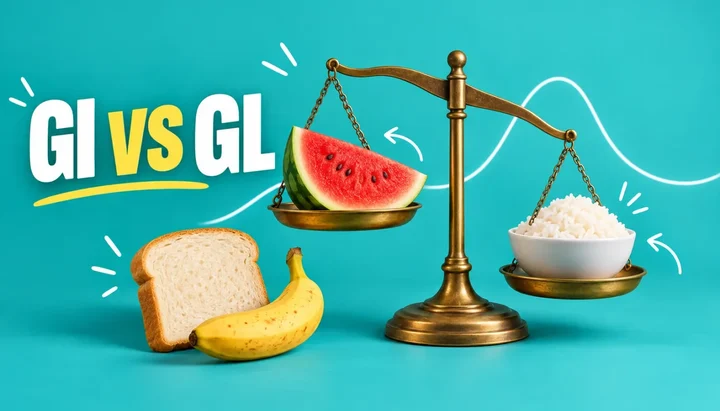
Glycemic index (GI) ranks a carbohydrate food by how fast it raises blood glucose, on a scale where pure glucose is 100. Glycemic load (GL) takes that rank and multiplies it by the grams of carbohydrate in the serving you eat. GI describes the food. GL describes the food and the portion together.
GI values checked on October 11, 2026 against the 2008 International Tables of Glycemic Index and Glycemic Load Values (Atkinson, Foster-Powell and Brand-Miller, University of Sydney) and the University of Sydney GI database. Glycemic load is our own arithmetic from the carbohydrate and fiber on each NutriScan food page.
Summary
- Glycemic index compares a food with pure glucose after people eat a portion holding 50 g of carbohydrate. The University of Sydney classes 55 or less as low, 56 to 69 as medium and 70 or more as high.
- Glycemic load = GI x available carbohydrate in your serving (g) / 100. The Linus Pauling Institute classes 10 or less as low, 11 to 19 as medium and 20 or more as high.
- Portion changes GL and leaves GI alone. One cup of cooked white rice has a GL of 32. Half a cup has a GL of 16. The GI is 73 both times.
- A high GI food can have a low GL. Puffed rice cakes test at 82, yet a 14 g cup of puffed rice holds so little carbohydrate that its GL is about 10.
- Published GI values are averages. The authors of the 2008 International Tables write that GI "should not be used in isolation". Use both numbers, and your own readings if you take them.
What is the glycemic index?
The glycemic index is a lab measurement. The FAO/WHO expert consultation on carbohydrates defines it as "the incremental area under the blood glucose response curve of a 50g carbohydrate portion of a test food expressed as a percent of the response to the same amount of carbohydrate from a standard food taken by the same subject."
In plain terms, volunteers eat enough of a food to get 50 g of carbohydrate, and their blood glucose is measured repeatedly afterward. On another day they take 50 g of pure glucose. The food's result divided by the glucose result, times 100, is its GI.
The University of Sydney GI database sorts the results into three bands:
| Band | GI |
|---|---|
| Low | 55 or less |
| Medium | 56 to 69 |
| High | 70 or more |
Every food is tested at the amount that gives 50 g of carbohydrate, and that amount can be far from what you eat. For watermelon it is several servings. For white rice it is about one cup.
What is glycemic load?
Glycemic load corrects for the serving. Atkinson, Foster-Powell and Brand-Miller describe it in the 2008 International Tables as "the product of the amount of available carbohydrate in a specified serving size and the GI value", divided by 100.
The Linus Pauling Institute at Oregon State University gives the textbook case in its GI and GL review. Watermelon has a GI of 76, which is high. A serving holds 11 g of available carbohydrate, so its GL is 8, which is low. A doughnut with the same GI of 76 holds 23 g and lands at a GL of 17.
The same review sorts glycemic load per serving into three bands:
| Band | GL per serving |
|---|---|
| Low | 10 or less |
| Medium | 11 to 19 |
| High | 20 or more |

How do you calculate glycemic load?
GL = GI x available carbohydrate (g) / 100
Available carbohydrate is total carbohydrate minus fiber, because fiber does not turn into blood glucose.
Here is the sum for white rice, using the numbers on our food page:
- One cup of cooked white rice (158 g) has 45 g of carbohydrate and 0.6 g of fiber.
- Available carbohydrate: 45 - 0.6 = 44.4 g.
- GI of boiled white rice in the 2008 International Tables: 73.
- GL = 73 x 44.4 / 100 = 32.4, which rounds to 32. That is high.
Now halve the portion. Half a cup has 22.2 g of available carbohydrate, so GL = 73 x 22.2 / 100 = 16, which is medium. Only the portion changed.
The fast version
Read the carbohydrate and fiber for your serving, subtract one from the other, multiply by the GI and move the decimal point two places left.
What are the GI and GL of common foods?
GI values in this table come from the 2008 International Tables unless the row says otherwise. Serving sizes and carbohydrate come from the linked NutriScan food page, and GL is rounded to the nearest whole number.
| Food | Serving | Available carbs | GI | GL |
|---|---|---|---|---|
| White rice, boiled | 1 cup cooked (158 g) | 44.4 g | 73 | 32 |
| Fufu, freshly pounded | 1 cup (100 g) | 30.5 g | 55 | 17 |
| Fufu, from processed powder | 1 cup (100 g) | 30.5 g | 31 | 9 |
| Potato, boiled | 1 medium (100 g) | 18.3 g | 78 | 14 |
| Banana | 1 medium (118 g) | 23.9 g | 51 | 12 |
| Puffed rice | 1 cup (14 g) | 12.4 g | 82 | 10 |
| White bread | 1 slice (28 g) | 13.4 g | 75 | 10 |
| Chickpeas | 1 cup (164 g) | 32.8 g | 28 | 9 |
| Wheat roti | 1 medium (40 g) | 14.6 g | 62 | 9 |
| Chapati | 1 medium (40 g) | 14.6 g | 52 | 8 |
| Apple | 1 medium (182 g) | 20.6 g | 36 | 7 |
| Oatmeal, rolled oats | 100 g cooked | 10.3 g | 55 | 6 |
| Lentils | 1/2 cup cooked (99 g) | 12.0 g | 32 | 4 |
| Carrots | 1 medium (61 g) | 4.3 g | 39 | 2 |
| Jaggery | n/a | n/a | not tested | n/a |
Fufu and puffed rice GI values are from the University of Sydney GI database. The puffed rice value is for a white puffed rice cake, the closest tested food. The carrot value is for boiled carrots. Where our nutrition numbers come from is on the NutriScan data sources page.
Read the table from the right-hand column and the order changes. Boiled potato has the highest GI of any whole food here, yet a cup of white rice carries more than twice its glycemic load, because the cup holds more than twice the carbohydrate.
What is the glycemic index of puffed rice?
No one has published a GI for loose puffed rice in the University of Sydney database. The closest tested foods are puffed rice cakes: a plain white one from Australia tested at 82, one made from Calrose rice at 91 and one made from Doongara rice at 61.
So puffed rice is a high GI food with a low glycemic load per cup. A cup weighs 14 g and holds 12.4 g of available carbohydrate on our puffed rice page, which gives a GL of about 10 at a GI of 82. Three cups in a bowl comes to about 30.
What is the glycemic index of fufu?
It depends on how the fufu is made. A 2017 study, Glycemic index of some local staples in Ghana, published in Food Science and Nutrition, tested two versions that the University of Sydney database now lists:
- Freshly pounded fufu (80% plantain, 20% cassava): GI 55, the top of the low band.
- Fufu from processed powder: GI 31.
Both were eaten with light soup and salmon, and the database flags the entries for wide variability, so read them as a range. With 30.5 g of available carbohydrate per 100 g cup on our fufu page, the GL comes to 17 for fresh fufu and 9 for the powdered kind. A bigger portion raises the load in step.
What is the glycemic index of wheat roti and chapati?
The 2008 International Tables list wheat roti at 62 (medium) and chapatti at 52 (low). Each figure is an average of several studies, with a standard error of 3 and 4 points.
The individual tests spread much wider. Chapatti entries in the University of Sydney database run from 28 to 76, and two chapattis tested in the UK came in at 58 and 68. Flour type, how thin the bread is rolled and what it was eaten with all move the number.
One 40 g chapati has 14.6 g of available carbohydrate, so its GL is about 8. One wheat roti of the same weight comes to about 9. Three with a meal put you in the high band on either figure.
What is the glycemic index of jaggery?
There is no tested value we can cite. As of October 11, 2026 the University of Sydney database has no entry for plain jaggery. It lists a jaggery rice dish from Pakistan at 95, which tells you about the rice as much as the sweetener.
Numbers such as 84 appear in review articles, but we could not trace one to a published GI test, so we have left it out. The nearest tested food is table sugar: sucrose averages 65 in the 2008 International Tables. Jaggery is unrefined cane or palm sugar, and a tablespoon of it counts toward your carbohydrate the same way a tablespoon of sugar does.

Which matters more, glycemic index or glycemic load?
For a single meal, glycemic load tells you more, because it includes how much you ate. GI is the better tool for comparing two foods you would eat in the same amount, such as two breads or two kinds of rice.
Both have limits. The authors of the 2008 International Tables write that "the GI should not be used in isolation" and that energy density and the rest of the nutrient profile count too. Table sugar averages 65 in the same tables, below boiled potato at 78, and nobody reads that as advice to trade potatoes for sugar.
If you have diabetes
This article is general information. GI and GL do not replace carbohydrate counting, medication or the targets your care team has set. If you have diabetes or take glucose-lowering medication, follow your doctor's advice before changing what you eat.
Why does the same food show different GI values?
GI is measured in small groups of people eating one specific version of a food. Change the version and the number moves. The Linus Pauling Institute's review lists ripeness, processing and cooking method among the things that change it, and the 2008 International Tables show the effect: rolled oat porridge averages 55 while instant oat porridge averages 79.
Meals add another layer. The same review cites work by Dodd and colleagues showing that a meal GI calculated from published values overestimated the measured value by 22 to 50%. A table value is a starting estimate for a food eaten alone, and a mixed plate usually behaves more gently than the sum suggests.
How do you lower the glycemic load of a meal?
The formula has two inputs, GI and grams of carbohydrate. Each step below lowers one of them.
- Shrink the carbohydrate portion. Going from one cup of white rice to half a cup takes the GL from 32 to 16.
- Swap to a lower GI food. A cup of chickpeas has nearly three quarters of the available carbohydrate of a cup of white rice and a GL of 9 instead of 32.
- Pick the less processed form. Rolled oats over instant oats is a 24 point GI difference in the 2008 International Tables.
- Check the serving you measure against the serving you eat. Every GL in the table above is for one stated serving. Three chapatis are three servings.
How do you check what a meal does to your own glucose?
A table gives you an average from other people. Your own response can differ, and the only way to see it is a reading taken after the meal.
NutriScan has a Glucose page for this, and it is on the free plan. You can type in a reading from a finger-prick meter or sync readings both ways with Apple Health or Health Connect. Tag a reading as "After meal" and the app links it to the nearest meal you logged in the same slot within 3 hours. The meal's Nutrition Details page then shows a Glucose card with the readings tied to it, and the Glucose page plots your day, week or month against a target band you set.
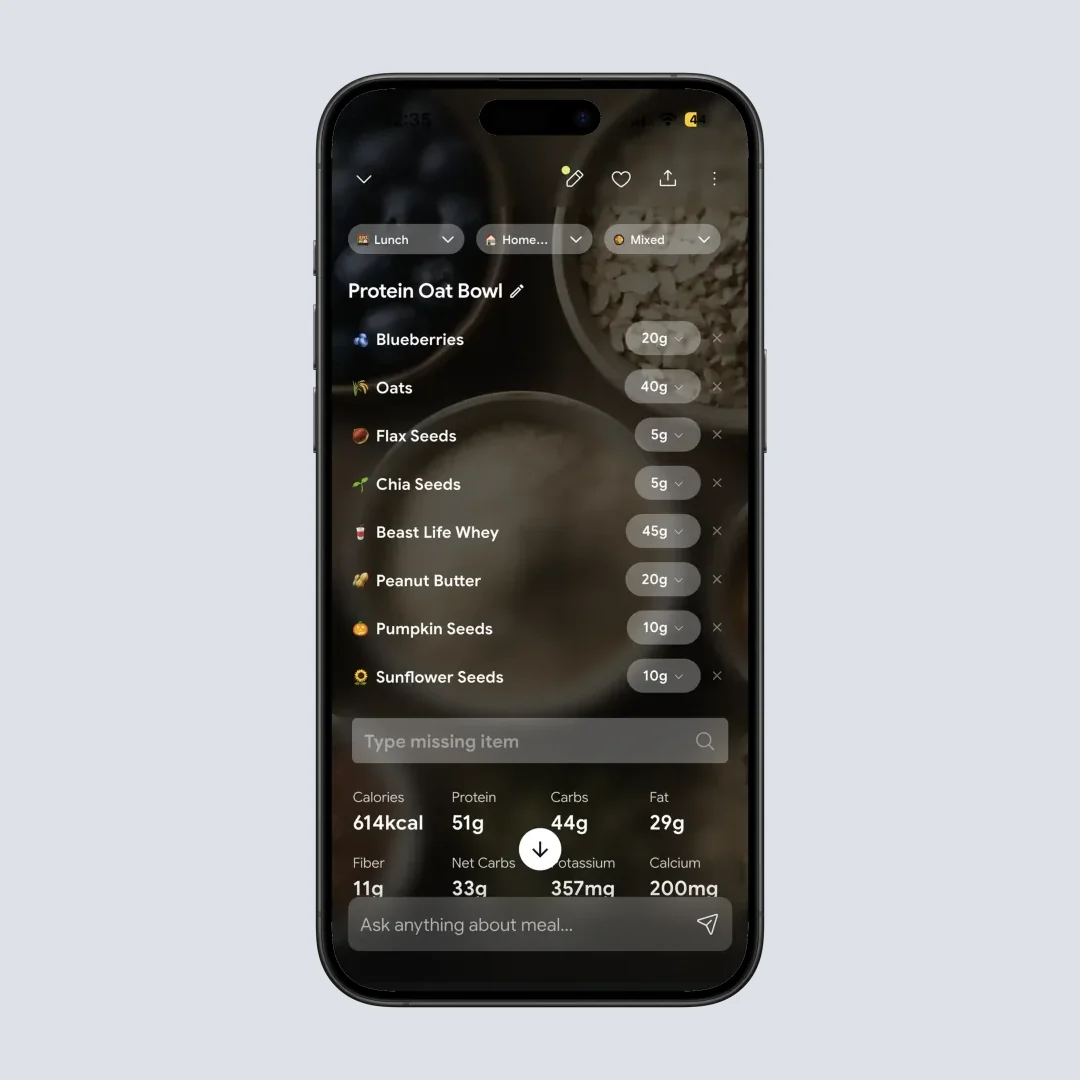
Nutrition Details for a logged meal. Carbohydrate and fiber for your actual portion are the two numbers the glycemic load formula needs.
The glucose feature is for your own tracking. It is not a medical device and it does not give medical advice. Scanning a plate also gives you the carbohydrate and fiber for the portion you ate, which is the input the GL formula needs. The free plan includes 5 scans a week. If you are choosing an app to pair with a sensor, our guide to the best apps for CGM users compares the options, and the diabetes macro calculator gives you a daily carbohydrate target to work from.
What else do people ask about glycemic index and glycemic load?
What is the difference between glycemic index and glycemic load?
Glycemic index (GI) ranks a food by how fast its carbohydrate raises blood glucose compared with pure glucose, which is set at 100. Glycemic load (GL) multiplies the GI by the grams of available carbohydrate in the serving and divides by 100. GI stays the same whatever the portion. GL goes up and down with the portion.
How do you calculate glycemic load?
Multiply the food's GI by the grams of available carbohydrate in your serving, then divide by 100. Available carbohydrate is total carbohydrate minus fiber. One cup of cooked white rice has 44.4 g of available carbohydrate and a GI of 73, so its GL is 73 x 44.4 / 100 = 32.
What counts as a low glycemic load?
The Linus Pauling Institute at Oregon State University classes a serving with a GL of 10 or less as low, 11 to 19 as medium and 20 or more as high. For GI, the University of Sydney uses 55 or less as low, 56 to 69 as medium and 70 or more as high.
What is the glycemic index of puffed rice?
The University of Sydney GI database has no entry for loose puffed rice. Its closest entries are puffed rice cakes, which tested between 61 and 91 depending on the rice variety, with a plain white puffed rice cake at 82. A 14 g cup of puffed rice carries 12.4 g of available carbohydrate, so at a GI of 82 its glycemic load is about 10.
What is the glycemic index of wheat roti?
The 2008 International Tables of Glycemic Index list wheat roti at 62 and chapatti at 52, both averaged across several studies. Individual chapatti entries in the University of Sydney database run from 28 to 76, because the flour, the thickness and the test meal change the result.
Does jaggery have a lower glycemic index than sugar?
There is no tested value to compare. The University of Sydney GI database has no entry for plain jaggery as of October 11, 2026, and table sugar (sucrose) averages 65 in the 2008 International Tables. Treat jaggery like any other sugar when you count carbohydrate.